Our Data
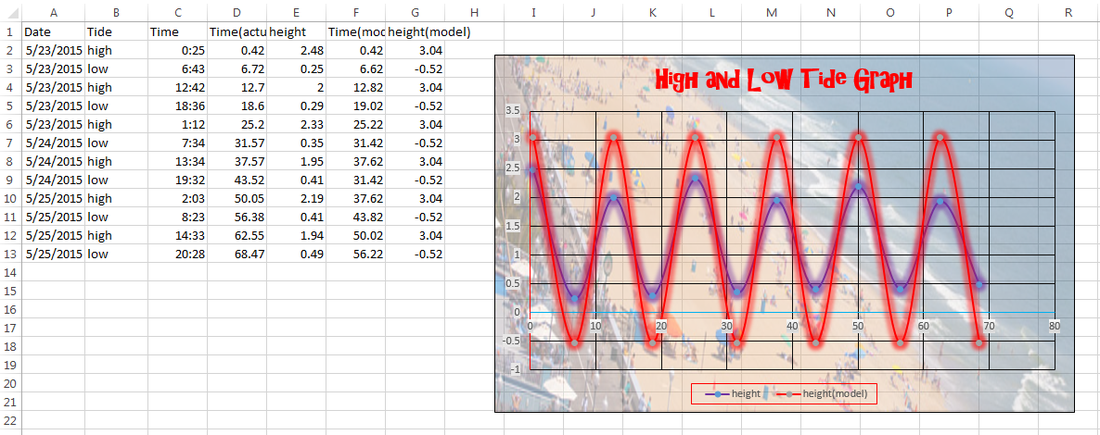
The graph shows the high and low tide data in Ocean City from 5/23 to 5/25. We converted the time from military to standard.
EQUATION : y = 1.78 cos(5π/31(x-.42)) + 1.26
RED LINES= HIGH TIDES
PURPLE LINES = LOW TIDES
EQUATION : y = 1.78 cos(5π/31(x-.42)) + 1.26
RED LINES= HIGH TIDES
PURPLE LINES = LOW TIDES
|
Average Low Tide = .37
Average High Tide = 2.15 Average of Averages = 1.26 which is our ( d ) in the equation |
amplitude ( | a | ) - 1.78
horizontal shift ( h ) -.42 period ( b ) - 5π/31 |
.
